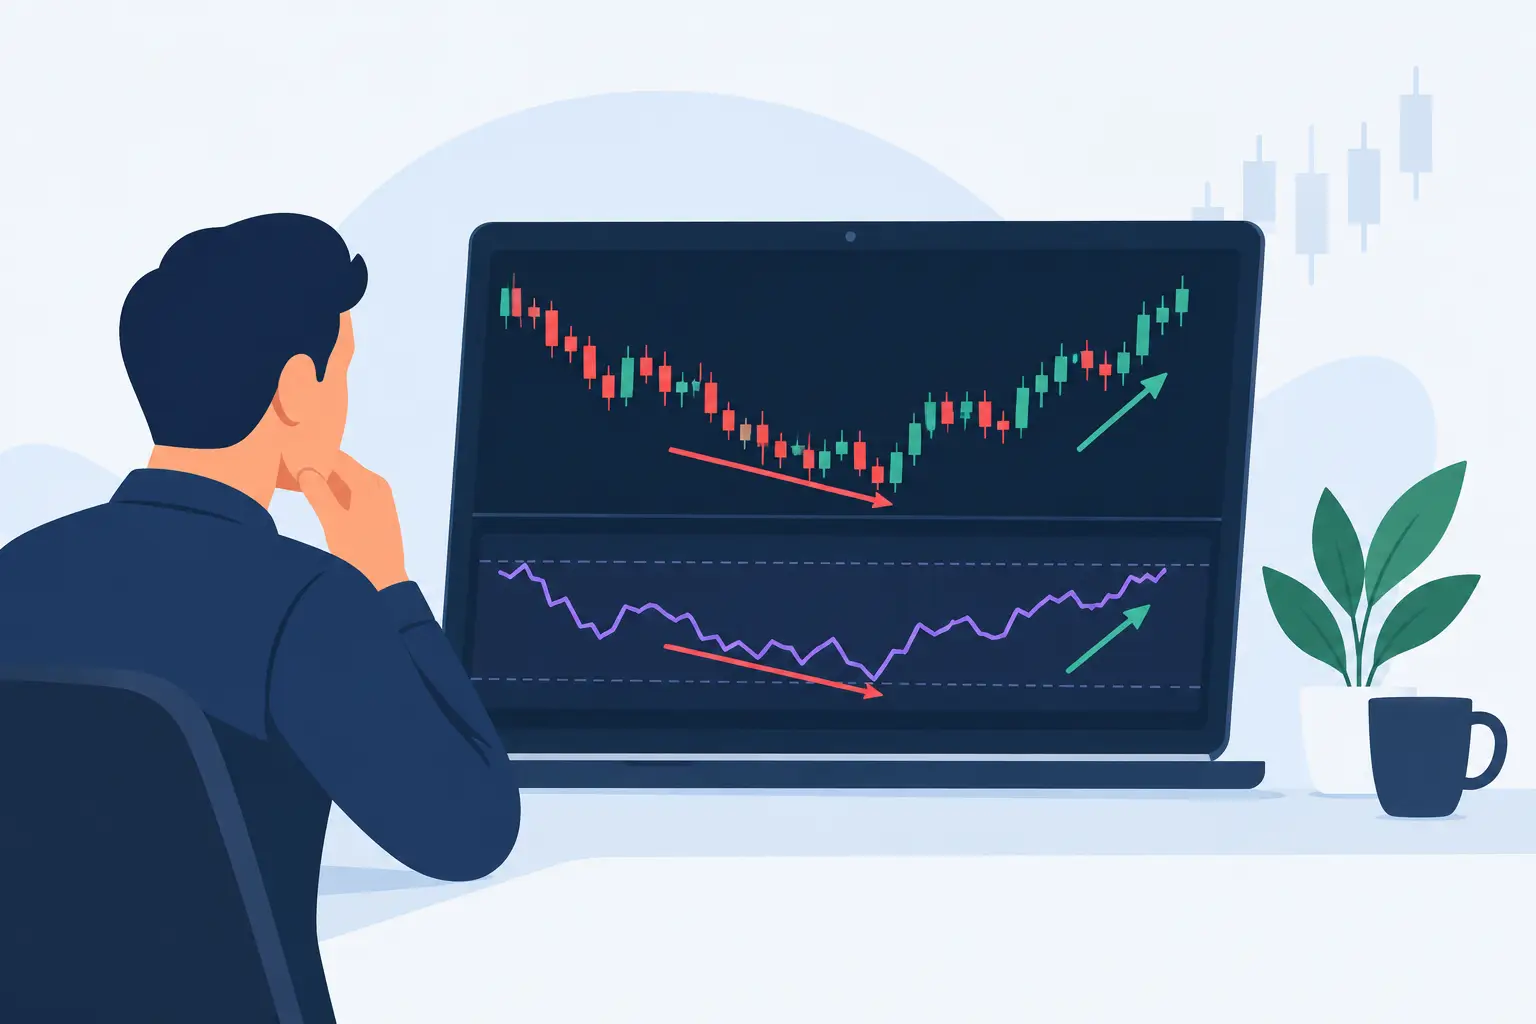
A stock can print a fresh low while selling pressure is already losing force. That disconnect is where an RSI divergence scanner earns its place on an active trader’s screen. It does not predict a reversal on its own. It flags a measurable conflict between price and momentum so you can stop chasing the move and start evaluating whether the setup has real structure.
For intraday traders, momentum traders, and options traders, divergence is most useful when it is treated as a condition inside a larger workflow. Price location, volume, trend, catalyst risk, liquidity, and a defined exit matter just as much as the RSI reading. The scanner finds candidates. Your rules determine whether a candidate deserves a trade.
What an RSI Divergence Scanner Actually Finds
The Relative Strength Index, or RSI, measures the speed and magnitude of recent price changes on a scale from 0 to 100. A common setting is 14 periods, although shorter settings can react faster for intraday trading and longer settings can reduce noise on higher time frames.
A divergence occurs when price and RSI disagree about the strength of a move. A scanner automates the comparison across a universe of symbols, time frames, and lookback periods. Instead of manually flipping through charts after the close or during a fast opening range, you receive a focused list of symbols where the relationship is present.
Bullish divergence
Bullish divergence forms when price makes a lower low while RSI makes a higher low. Sellers pushed the chart to a new low, but the momentum measure did not confirm that new wave of selling. This can precede a bounce, a trend reversal, or simply a pause before the next leg down.
That last outcome matters. Bullish divergence is not a buy signal merely because it exists. In a heavy market selloff or a stock with a fresh negative catalyst, the apparent divergence can persist while price continues lower. The better question is whether price can reclaim a level that proves buyers are taking control.
Bearish divergence
Bearish divergence is the opposite: price makes a higher high while RSI makes a lower high. Price is still advancing, but upside momentum is fading. For a long trader, it can be a warning to tighten an exit or avoid adding at an extended level. For a short-biased trader, it can identify names worth watching for a failed breakout or a break below support.
Bearish divergence is especially easy to misuse in strong momentum names. A stock can show weakening RSI and still grind higher for days. The scanner should highlight a possible exhaustion setup, not give permission to short strength without confirmation.
Build the RSI Divergence Scanner Around Tradeable Conditions
The basic scan logic is straightforward: identify two relevant swing points in price, compare the RSI values at those points, and require the direction of the two moves to conflict. The details determine whether the output is a useful shortlist or a noisy pile of charts.
Start with the trading horizon. A 5-minute scan may help identify intraday reversals after an opening flush, while a 60-minute or daily scan is more relevant to swing entries. Mixing them without a plan produces confusion. A daily bullish divergence can coexist with a bearish 5-minute setup because each is measuring a different auction.
Next, define what counts as a swing high or low. If every minor bar wiggle is treated as a pivot, the scanner will create too many weak signals. Requiring a pivot to be the lowest or highest point within a defined number of bars helps separate meaningful structure from random movement. A trader might require a five-bar pivot on a 15-minute chart, then compare the two most recent confirmed pivots.
Price and volume filters are not optional for most active traders. A divergence in a thin, $2 stock with a wide spread is often difficult to execute and harder to exit. Consider minimum price, average dollar volume, relative volume, and maximum spread requirements before the signal reaches your watchlist. If you trade options, add option volume, open interest, spread width, delta range, and acceptable days to expiration.
A practical scanner also needs a recency rule. A divergence found six sessions ago may already be resolved. For an intraday workflow, a signal may only be useful for the current session or the most recent few bars. For swings, you might allow several trading days but require price to remain above the divergence low for a bullish setup or below the divergence high for a bearish one.
Confirmation Turns Divergence Into a Setup
The cleanest RSI divergence trades usually have a second reason to act. That confirmation can be structural, volumetric, or event-driven, depending on your strategy.
For a bullish reversal, a common sequence is lower low in price, higher low in RSI, then a reclaim of a prior candle high, VWAP, opening-range level, or short-term moving average. Volume expanding on the reclaim is more persuasive than a low-volume drift. The entry is not at the moment RSI diverges; it is at the moment price behavior confirms that the divergence may be resolving.
For a bearish setup, watch for a higher high in price, lower high in RSI, then failure at resistance or loss of a clearly defined support level. If the broader index and sector are also weakening, the signal has more context. If the stock is leading a high-volume breakout after earnings, the same divergence may be a poor short candidate.
This is where a market-ranking workflow can improve the scan. Prioritize symbols with enough liquidity and movement to matter, then examine whether trend, volume surge, volatility, float, short interest, news, and opening-range conditions support the trade idea. A divergence scanner is strongest as one layer in the decision stack, not the entire stack.
Define the Entry, Stop, and Exit Before the Alert Fires
A scanner alert without trade management is just an interesting notification. Define the rule set while the market is calm.
For bullish divergence, the invalidation point is often below the most recent price low. The stop distance must fit the symbol’s normal volatility and your maximum loss per trade. If the logical stop is too wide, reduce size or skip the setup. Tightening the stop just to make position size larger usually converts normal price movement into avoidable losses.
Profit targets should reflect nearby chart structure. A first target might be VWAP, the opening range, a prior support-turned-resistance level, or a measured move from the reversal base. Some traders take partial profits at the first objective and trail the remainder below higher lows. Others use a fixed risk-reward threshold. Neither is automatically better - the right choice depends on what your testing shows for that time frame and market condition.
For options, the underlying chart remains the primary signal. A bullish divergence on the stock does not justify buying an out-of-the-money call with poor liquidity and a short expiry. Use contracts with spreads and delta that fit the planned holding period, and account for theta and implied-volatility changes around earnings or major macro events.
Test the Scanner Against the Conditions You Trade
The most valuable question is not whether RSI divergence can work. It is which version works for your symbols, time frame, entry trigger, and exit logic.
Test bullish and bearish signals separately. Segment results by market regime, such as broad index trend, high-volatility sessions, earnings weeks, and low-volume holiday conditions. A setup that performs well after a multi-day pullback in liquid large-cap stocks may fail during low-float news spikes. Keep the data honest by including slippage, realistic fills, commissions where relevant, and alerts that occur only after the pivot is confirmed.
Avoid optimizing every setting until historical results look perfect. If a strategy only works with one exact RSI length, a narrowly defined pivot count, and a single target, it may be fitted to past noise. Favor rules that make market sense and remain reasonably stable when settings change slightly.
Periodic Gains can help turn this workflow into a controlled experiment: create the rules in plain English, code, or alert logic, run them in the Strategy Lab against real-time simulated market data, and enforce position, stop, and end-of-day controls before live capital is involved. The goal is not to automate a chart pattern blindly. It is to measure the complete decision process.
Common RSI Divergence Scanner Mistakes
The first mistake is scanning every ticker and treating all divergences as equal. Focus on the liquid symbols and trading conditions your strategy is designed to handle. A smaller, better-ranked list beats fifty alerts that cannot be acted on.
The second is entering before confirmation. Divergence identifies fading momentum, not necessarily a completed reversal. Waiting for a reclaim, a breakdown, a volume shift, or a clear candle pattern may mean entering later, but it can materially improve the quality of the trade.
The third is ignoring scheduled risk. Earnings, Federal Reserve announcements, inflation data, and major company news can overwhelm a technically clean setup in seconds. Your scanner should be paired with an event calendar and a rule for whether signals are allowed before known catalysts.
Finally, do not confuse a valid signal with a required trade. The best scanners create disciplined choices. If price is extended, the stop is too wide, options spreads are poor, or the broader market directly conflicts with the setup, passing is a decision with value.
A good divergence alert should make your next action clearer: mark the level, wait for confirmation, define the risk, and let the chart prove whether momentum is truly changing.